Value Stream Mapping a GCC Shared Services Handoff
October 20, 2026
Like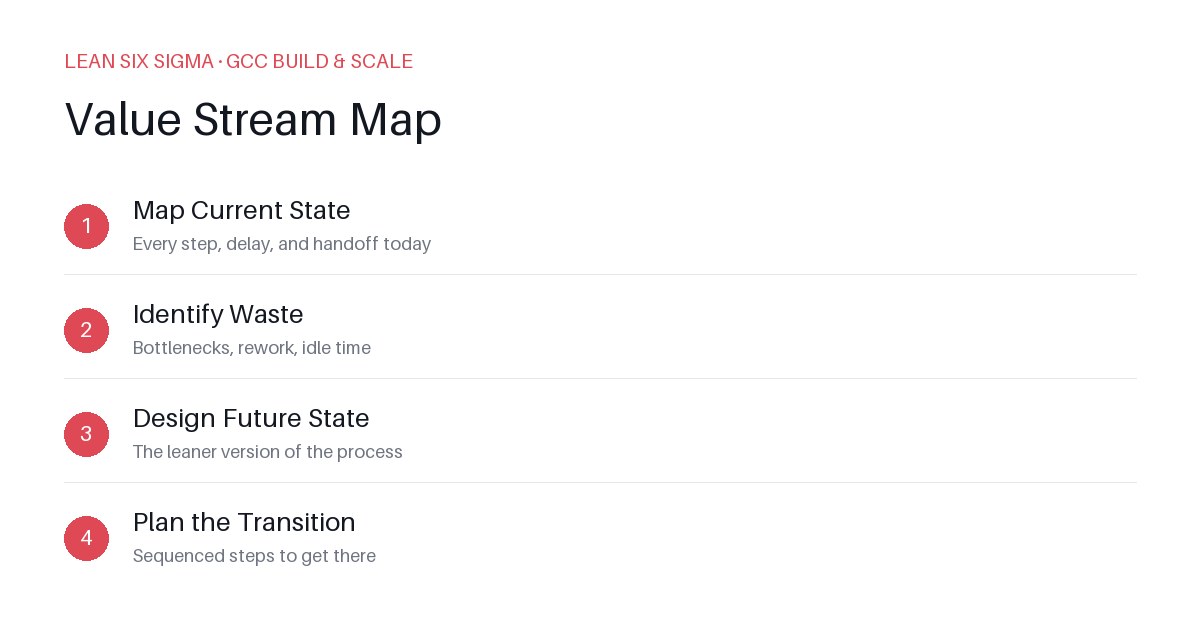
Downloadable templates
Map the handoff between delivery and shared services to eliminate delays, rework, and handoff errors.
Why Handoffs Fail in GCCs
Shared services exist to remove bottlenecks, but they often become them. The handoff between the delivery team and the shared service team is where value leaks fastest. Teams hand off work with incomplete context, inconsistent formats, or unclear acceptance criteria. The shared service team then spends cycles clarifying, reworking, or waiting.
Value Stream Mapping (VSM) exposes this. It turns invisible handoff friction into visible process steps, wait times, and defect rates. You stop guessing where delays come from. You see them.
Step 1: Define the Handoff Scope
Don’t map the entire GCC. Map one handoff. Example: “Delivery team hands off a completed API module to the shared service QA team for automated test integration.”
Define:
- Start event: Delivery team marks the module as “ready for QA.”
- End event: Shared service QA team begins automated test execution.
- Boundaries: What happens before and after are out of scope for this map.
Step 2: List Every Step in the Handoff
List every action, decision, and wait between start and end. Include:
- Writing test cases
- Updating test automation scripts
- Review by shared service lead
- Deployment to test environment
- Execution of tests
- Defect logging
Skip high-level phases. Get granular. If a step takes less than 5 minutes, it’s still a step.
Step 3: Add Lead Time and Cycle Time
For each step, record:
- Lead time: Time from when the step is triggered to when it starts.
- Cycle time: Time from when the step starts to when it finishes.
Example:
- Writing test cases: Lead time = 2 days (waiting for delivery team to provide specs), Cycle time = 1 day.
- Review by shared service lead: Lead time = 1 day (queue), Cycle time = 4 hours.
Use real data. Ask team members. Use timestamps from Jira or your tracking tool. Don’t estimate.
Step 4: Identify Value-Added vs. Non-Value-Added Work
Value-added work directly contributes to the end event. Non-value-added work does not.
Examples:
- Value-added: Writing test cases, executing tests.
- Non-value-added: Waiting for specs, queueing for review, reworking due to unclear requirements.
Highlight non-value-added steps. These are your targets for improvement.
Step 5: Calculate Process Efficiency
Process efficiency = (Total value-added time) / (Total lead time from start to end).
Example:
- Total value-added time: 3 days
- Total lead time: 12 days
- Efficiency: 25%
This number tells you how much of the handoff is pure process and how much is waste.
Step 6: Spot the Bottlenecks and Defects
Look for:
- Steps with the longest lead times (queues, waits, approvals).
- Steps with the highest defect rates (rework, returns, unclear requirements).
- Steps that block the flow (single points of failure).
Example: If the shared service QA team waits 2 days for specs from delivery, that’s a bottleneck. If 30% of test cases require rework, that’s a defect problem.
Step 7: Design the Future State Map
Redraw the handoff with improvements. Examples:
- Standardize handoff format: Use a template with required fields (module name, endpoints, expected behavior, known issues).
- Reduce queue time: Assign a QA lead to review test cases within 4 hours.
- Eliminate rework: Add a pre-handoff checklist for delivery teams.
Show the new lead times, cycle times, and efficiency. Compare to the current state.
Step 8: Implement and Measure
Pick one non-value-added step to eliminate or reduce. Example: Reduce QA review queue from 1 day to 4 hours.
Implement the change. Track the step for two weeks. Measure:
- New lead time
- New cycle time
- Defect rate
- Overall process efficiency
If it works, scale the change. If not, adjust and try again.
Common Mistakes to Avoid
- Mapping too broadly: You lose focus. Stick to one handoff.
- Using estimates: You get noise. Use real data.
- Ignoring defects: Time matters, but quality matters more. Track rework.
- No future state: You’ll just have a report. Design the improvement.
- No measurement: You’ll never know if it worked. Track before and after.
Real Example
A GCC team mapped the handoff between development and shared services for API documentation. Current state: 10-day lead time, 40% rework, 20% process efficiency. Future state: 3-day lead time, 10% rework, 60% process efficiency. Changes: Standardized doc template, automated review checklist, dedicated QA reviewer.
Result: Faster delivery, fewer errors, happier teams.
Start small. Map one handoff. Fix one bottleneck. Measure the result. Repeat.
Comments
Be the first to comment on this post.
Sign in to leave a comment.